
Official WordPress Free
WordPress Plugin That Visualizes Page Views as a Treemap
Visualize Your Content Performance
You can visualize the performance of content managed in WordPress as a treemap.A treemap is a type of infographic that visualizes data using hierarchically arranged tiled rectangles. By visualizing your data, anyone can grasp the information intuitively, which streamlines the work involved in analyzing content marketing data.
How Visualization Works
Admin Dashboard
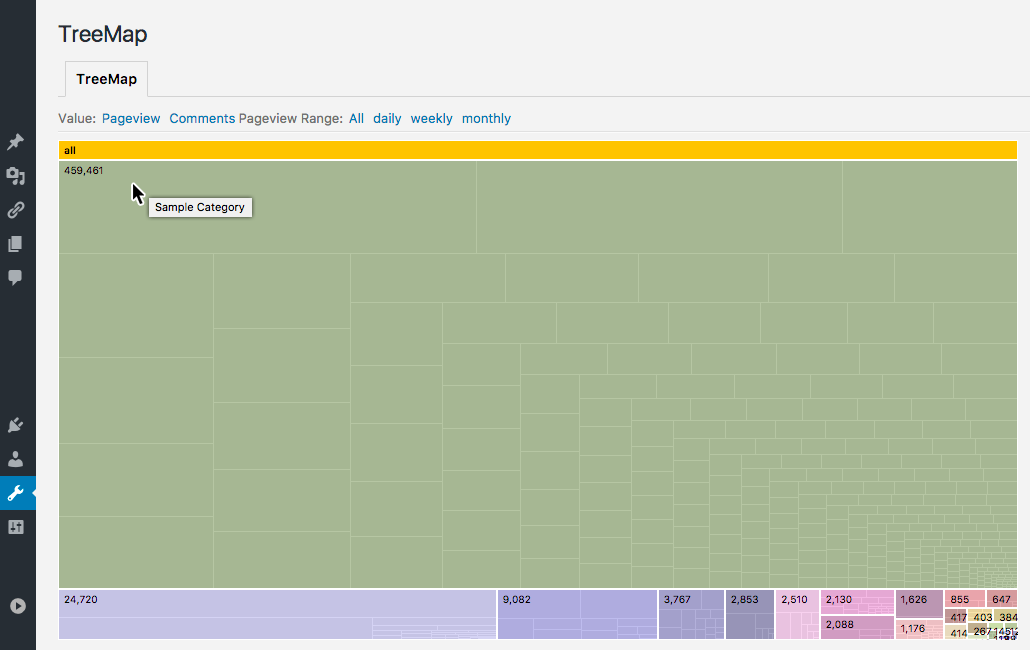
WordPress Dashboard > Tools > LIQUID TREEMAPFirst Level (Categories)
The first level displays the performance of the entire site broken down by category.The page view figure determines the size of each rectangle. The larger the size, the more views that category has received.
Hover with the mouse to see the category name.
Second Level (Posts)
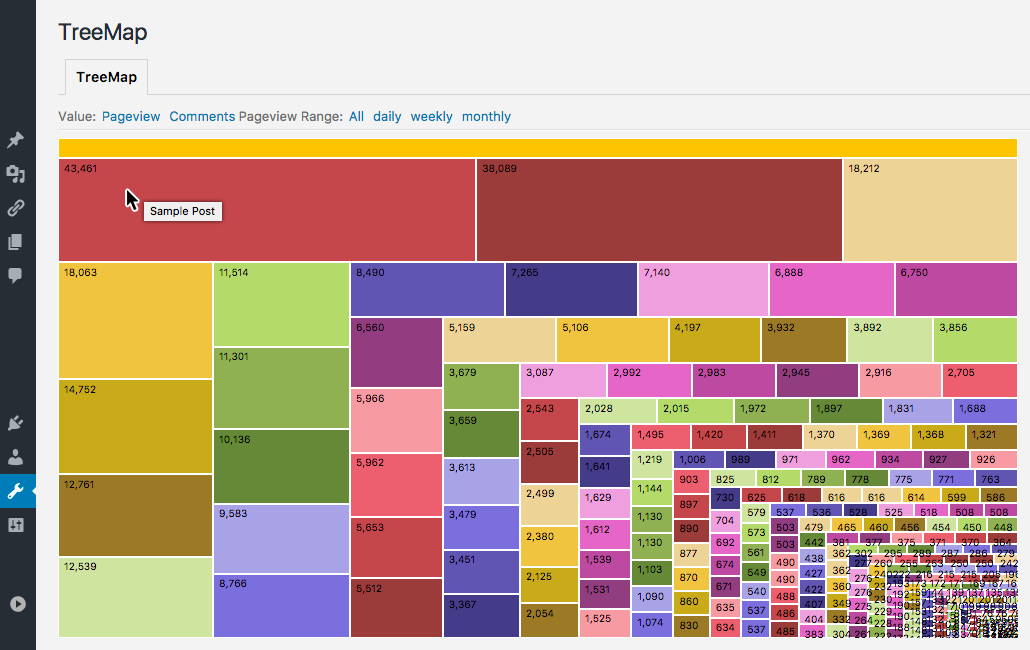
Clicking a category switches to the second level, which displays individual posts.The page view figure determines the size of each rectangle. The larger the size, the more views that post has received.
Hover with the mouse to see the post title. Click the bar at the very top to return to the first level.
Filtering the Displayed Data
Data Source
You can switch between page views (*Pageview) and number of comments (Comments).Data Period
You can switch between All (*All), daily, weekly, and monthly.Feature List
Levels
- Categories
- Posts
Data Types
- Page views (*WordPress Popular Posts is required)
- Number of comments
Page View Periods
- All (*most recent 300 items)
- Daily
- Weekly
- Monthly
| LIQUID TREEMAP, the WordPress plugin that visualizes page views as a treemap | |
|---|---|
| Price | Free |
| Specifications | Plugin listed in the official WordPress directory
WordPress Popular Posts is required to display page views |
| License | GPL (commercial use allowed, copyright notice may be removed, no limit on the number of installations) |
| Requirements | WordPress 4.1 or later |
Free Download
Or search for LIQUID TREEMAP from the WordPress dashboard